Most Australian workplaces should plan for somewhere between 8 and 14 square metres of gross office space per employee, with a common industry baseline sitting at around 10 square metres once you include shared areas. That range shifts hard depending on role, layout and how many people are actually in the building on a given day. Before you lock in a number for a lease negotiation or fit-out brief, work through the calculation examples and the WHS checklist below.
TL;DR:
- Businesses should base their office space planning on real occupancy data to avoid over- or under-estimating space needs and lease costs.
- The typical Australian office uses between 8 and 14 square metres per employee, with higher requirements for private offices and client-facing roles.
- Fitting out a space efficiently involves understanding gross versus net area and adjusting for presence rates, which can significantly alter total required space.
- Safety and WHS regulations impose minimum clearances, meaning office density must also meet physical and psychosocial safety standards.
- Shifts toward hybrid work have decreased overall leased area per employee but increased space allocated per person in use, emphasizing flexible layouts and sustainability.
Table of Contents
- Recommended office space per employee ranges by workplace type
- What actually changes how much space each person needs
- How to calculate your office space per employee
- What WHS rules and building codes actually require
- Turning your total square metres into a usable floor plan
- Practical ways to reduce office space per employee without cutting corners
- Modelling your own numbers with a space calculator
- Checklist: from estimate to signed lease
- Does office space per employee affect productivity and wellbeing?
- How office space standards differ across industries and countries
- How office space per employee has changed since COVID-19
- Sustainability considerations when allocating office space
- What different space allocations cost your business
- Sources
Recommended office space per employee ranges by workplace type
The 8 to 14 square metre figure is a starting point, not a formula. Where your organisation sits inside that band depends heavily on what your people actually do all day, and whether they’re private-office professionals or hot-desking call centre staff barely present half the week.
Three practical bands cover most Australian workplaces:
- High-density (8–10 m² per person): Call centres, shared service hubs and any hot-desking environment with low average presence. Desks are unassigned, benching is tight, and the model only works because not everyone shows up on the same day.
- General open-plan (10–14 m² per person): The typical professional office, mixing individual workstations with meeting rooms, breakout zones and some collaboration space. Most mid-size corporate tenants land here.
- Professional and client-facing (14–20 m² per person): Law firms, senior leadership floors and any business where private offices, client meeting suites or larger boardrooms eat into the per-person average. Servcorp’s guidance puts firms with heavy private-office requirements well above the general open-plan band.
One detail trips up a lot of first-time space planners: these figures are almost always gross area, meaning they include corridors, kitchens, server rooms, reception and toilets, not just the desk itself. A net figure, which strips out shared building services like lift lobbies and stairwells, will always read smaller for the same headcount. If a lease document or fit-out quote quotes you a number, ask which basis it’s using before you compare it to any of the bands above. Getting that mixed up is the single most common reason a business ends up leasing the wrong amount of floor space.
What actually changes how much space each person needs
Two teams of the same size can need wildly different floor areas, and the gap usually comes down to five variables.
Task and role type drives more of the variance than most people expect. A developer who needs two hours of uninterrupted focus time daily has different spatial needs to a sales team that lives in huddle rooms. Safe Work Australia’s good work design guidance frames this explicitly: density decisions should account for cognitive and psychosocial demands, not just square metres and headcount.
Occupancy and presence assumptions matter just as much. If your roster shows 60% average desk presence because of hybrid work, you don’t need one desk per employee. This is where a lot of legacy office leases become expensive mistakes: they were signed assuming five-day, full-headcount attendance that never eventuated post pandemic.
Layout and furniture choices compress or expand the same headcount dramatically. Benching systems using standard 1.8 metre bench widths pack people tighter than private offices or even standard assigned desking.
Growth buffer is the factor most businesses skip and regret. Workplace advisors often recommend planning at a softer density, such as one person per 14 square metres, specifically to absorb headcount growth without triggering an early re-lease.
Pro Tip: Before you fix a density target, pull three months of building access or desk-booking data if you have it. Guessing presence rates is the fastest way to over-lease or under-plan.
How to calculate your office space per employee
Start by nailing down which measurement you’re actually working with. Gross area includes everything inside the tenancy, common areas and services. Net lettable area (NLA) strips out shared building infrastructure like lift shafts, fire stairs and plant rooms, so it will always read lower for the same footprint. Net usable area goes further again, excluding internal corridors and structural columns too. Commercial property advisors point out that mixing these up is one of the most common errors in early-stage space planning.
The core formula for planning purposes is:
Required gross area = target sqm per person × planned headcount × (1 ÷ average presence rate)
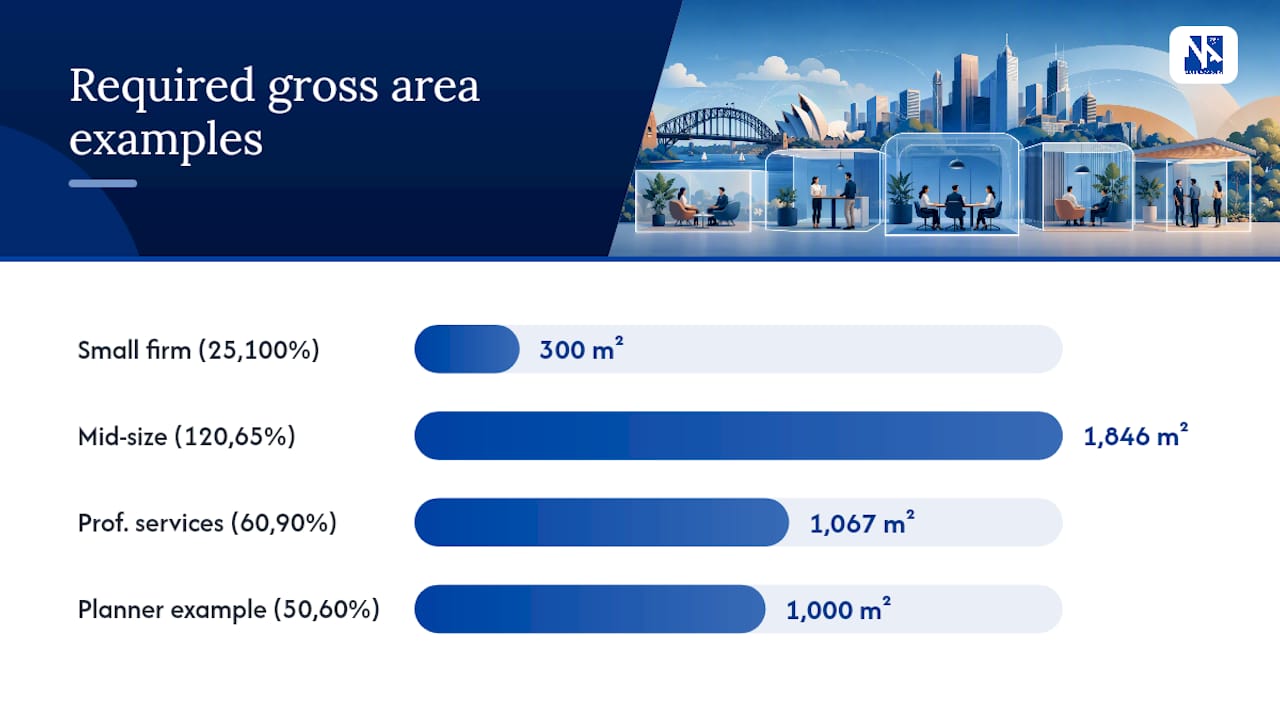
If your business runs at full daily attendance, the presence rate is 1 and this simplifies back to a straight multiplication. If you’re hybrid, the presence rate adjustment stops you from over-leasing for desks that sit empty three days a week.
Three worked examples show how this plays out at different scales:
- Small professional firm, 25 staff, full attendance, 12 m² target: 12 × 25 × (1 ÷ 1) = 300 m² gross. Straightforward, no presence discount because everyone’s in daily.
- Mid-size business, 120 staff, 65% average presence, 10 m² target: 10 × 120 × (1 ÷ 0.65) ≈ 1,846 m² gross. The presence discount effectively adds hundreds of square metres of headroom compared to planning on raw headcount alone.
- Professional services firm, 60 staff, 90% presence, 16 m² target (private offices): 16 × 60 × (1 ÷ 0.9) ≈ 1,067 m² gross. Higher density target per person, but a smaller headcount discount because attendance is consistently high.
What WHS rules and building codes actually require
There’s a firm floor beneath how tightly you can pack a floor plan, and it’s set by workplace safety law, not by what fits on a spreadsheet.
WorkSafe Victoria’s compliance code for workplace facilities sets out specific minimum clearances. Movement space between equipment, desks and structures needs at least 800 mm clear, and dining or lunch areas require roughly 1 square metre of clear space per person using them. The code also splits workplace areas into primary, secondary and tertiary space categories, which matters when you’re deciding what counts toward your per-person figure and what’s genuinely optional.
The 10 m² baseline is the most commonly cited industry reference figure, used in commercial property guidance as a rough planning benchmark that assumes reasonable ventilation and occupancy loads. It’s a starting point for negotiation, not a compliance minimum in itself.
Beyond the physical clearances, Safe Work Australia’s good work design framework brings in a psychosocial dimension: density that’s technically compliant on paper can still be unsafe if it increases noise, reduces privacy for sensitive conversations, or removes any quiet space for focused or high-stress tasks.
A short sign-off checklist before any layout goes to construction:
- Movement clearances meet or exceed 800 mm between fixed structures and workstations.
- Dining and breakout areas provide roughly 1 m² of clear space per expected user.
- High-density zones have an adjacent quiet or low-stimulation space available.
- Consultation with affected staff has happened before final layout approval.
Turning your total square metres into a usable floor plan
A gross area figure is only useful once you split it into the zones people actually work in. Workplace planners generally group floor space into three categories: primary space (individual workstations and personal work points), secondary space (meeting rooms, breakout areas, phone booths, collaboration zones) and tertiary space (reception, kitchens, storage, plant and circulation).
Layout choice has a direct multiplier effect on your per-person number:
- Benching systems using standard 1.8 metre bench widths deliver the tightest per-person footprint and suit high-density, hot-desking environments.
- Assigned individual desking needs more circulation space per person than benching because desks aren’t shared, pushing density toward the middle of the general open-plan band.
- Private offices consume the most area per head and are the main reason professional services firms sit at the top of the 14 to 20 square metre range.
- Touchdown and hybrid zones flip the maths entirely, since they support far more staff than desks by relying on rotating presence rather than one-to-one allocation.
Meeting room ratios typically run one small meeting room per 10 to 15 staff in a collaborative office, with circulation allowances of roughly 1 to 1.5 metres of aisle width kept clear throughout.
Practical ways to reduce office space per employee without cutting corners
Trimming your footprint doesn’t have to mean cramming people in. The most reliable savings come from acting on real data rather than guesswork.
- Run occupancy analytics before you commit to a density target. Desk-booking systems and sensor data show actual presence patterns, which advisors consistently point to as the most reliable way to convert a theoretical ratio into a real desk count.
- Choose flexible, multi-purpose furniture over single-use rooms. A room that converts between a training space and four bookable desks earns its floor area twice over.
- Digitise records and consolidate storage into shared lockers. Filing cabinets and personal storage units are some of the easiest square metres to reclaim, and the savings compound across a whole floor. Our space-saving fit-out guide covers specific tactics that work in practice.
- Treat density changes as a change management project, not a furniture order. Consultation with affected staff isn’t optional once a layout change affects how people work; it’s a legal obligation under WHS law, and skipping it tends to cause far more disruption than the space saving is worth.
Pro Tip: Pilot any density change on one floor or team before rolling it out business-wide. A four-week trial with real feedback beats a business case built entirely on assumptions.
Modelling your own numbers with a space calculator
Running the formula by hand works for a single scenario, but most businesses need to test several headcount and presence combinations before they commit to a lease size. That’s exactly what Niche Advisory’s Office Space Calculator App is built for. You feed in your planned headcount, expected presence rate, target density band and an ancillary space percentage, and it returns a gross area estimate you can take straight into lease negotiations.
A quick example shows the mechanics: 50 staff, 60% average presence, targeting 12 square metres gross per person. Run through the formula, and you land at roughly 12 × 50 × (1 ÷ 0.6) ≈ 1,000 square metres before ancillary allowances.
Niche Advisory has spent more than 12 years running exactly this kind of scenario modelling for corporate tenants across the country, backing calculator outputs with independent lease advisory and workplace strategy work. If you want a second worked example specific to your building type or industry, our Sydney square meterage guide walks through a local case study in more depth.
Checklist: from estimate to signed lease
Once you’ve got a workable gross area figure, six steps carry you from spreadsheet to signed deal.
- Collect real occupancy data — desk-booking logs, swipe-card records, or at minimum a staff attendance survey over four to six weeks.
- Pick your density band based on role mix, not just industry averages, and sanity-check it against the WHS clearances above.
- Calculate gross area using the presence-adjusted formula, then add contingency for growth and ancillary space.
- Check fit-out and services requirements — ventilation capacity, power and data points, and meeting room count all need to match the new density before you sign anything.
- Get sign-off from WHS, HR and staff representatives before finalising layout, since consultation is a legal requirement wherever a density change affects how people work.
- Engage a workplace advisor if your headcount plans span multiple sites, involve lease negotiation, or if you’re unsure whether your numbers will hold up against landlord assumptions. Our space planning service picks up from exactly this point.
Does office space per employee affect productivity and wellbeing?
Cramming people too tightly does measurable damage, and it’s not just about comfort. Safe Work Australia’s good work design framework treats density explicitly as a psychosocial factor: noise, lack of privacy and constant visual disruption raise stress and cut into the kind of sustained focus that knowledge work depends on.
The relationship isn’t linear, though. More space doesn’t automatically mean happier or more productive staff. A poorly zoned office at 16 square metres per person, with no quiet rooms and meeting spaces in all the wrong places, can perform worse than a well-designed 10 square metre layout with proper acoustic separation and a genuine mix of settings.
What matters more than the raw number is variety. Staff need a mix of focus zones, informal collaboration space and social areas, matched to what their actual work demands. A call centre team doesn’t need private offices, but it does need break areas that let people properly disconnect between calls. A legal team drafting sensitive documents needs acoustic privacy that open-plan benching simply can’t deliver, regardless of how many square metres it occupies.
The practical takeaway for planners: treat your density target as a starting budget, then spend it deliberately across primary, secondary and tertiary zones rather than applying it uniformly across the floor. Getting that allocation wrong is a far more common cause of workplace complaints than the raw gross area figure ever is.
How office space standards differ across industries and countries
There’s no single global standard for office space per employee, and Australian planning figures don’t always translate directly overseas. Density expectations move with labour costs, real estate prices and cultural norms around personal space.
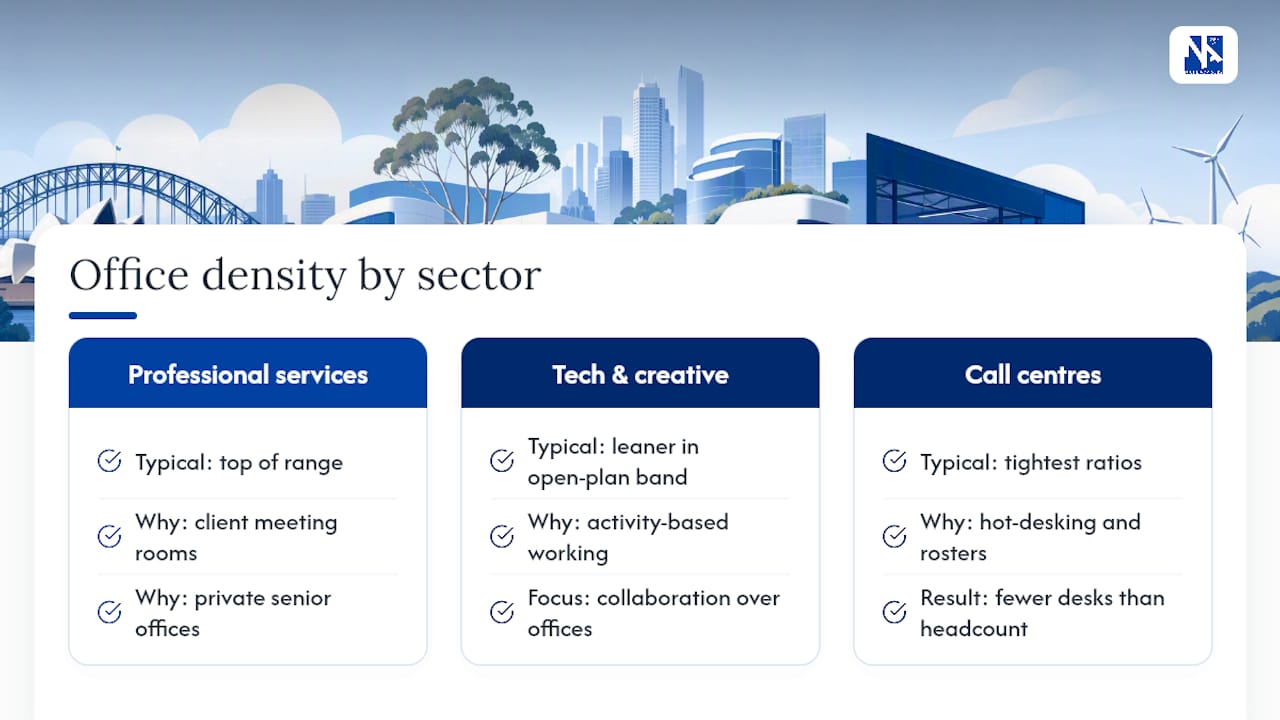
Within Australia, industry is the bigger variable than geography. Professional services firms, particularly law and accounting, consistently sit at the top of the range because client meeting rooms and private offices for senior staff eat into the average. Technology and creative businesses tend to run leaner, often adopting activity-based working models that push density toward the high end of the general open-plan band while investing heavily in collaboration space instead of individual offices. Call centres and shared service operations run the tightest ratios of any sector, since hot-desking and rostered shifts mean far fewer desks are needed than total headcount would suggest.
Internationally, high-density markets like Hong Kong and Tokyo operate at densities well below the Australian 8 to 14 square metre band, driven by real estate scarcity rather than workplace design philosophy. North American offices, by contrast, have historically trended more generous, though that gap has narrowed as hybrid work reshapes leasing decisions everywhere.
The practical lesson for Australian businesses: benchmark against your own industry and role mix first, not against a headline number from an overseas market with entirely different real estate economics.
How office space per employee has changed since COVID-19
The pandemic didn’t just dent attendance figures temporarily. It permanently reset how businesses think about the relationship between headcount and floor area.
Pre-pandemic planning assumed close to full daily attendance, and lease sizes were negotiated on that basis. Hybrid work broke that assumption for good.
That’s the paradox worth understanding: total leased area per employee has fallen for many businesses, because fewer desks are needed overall, but the space allocated to each person present on any given day has often grown. Businesses are trading desk quantity for desk and amenity quality, investing in better collaboration zones, acoustic treatment and breakout areas rather than rows of identical workstations.
This has pushed more organisations toward the presence-adjusted calculation method described earlier in this guide, rather than the old flat headcount multiplication. It’s also driven renewed interest in shorter lease terms and more flexible fit-outs, since nobody wants to sign a decade-long commitment to a density assumption that might not hold in three years.
Sustainability considerations when allocating office space
Every square metre of office space carries an ongoing energy and resource cost, which makes space efficiency a sustainability lever as much as a financial one. Overallocating space per person means heating, cooling and lighting more floor area than the workforce actually needs, day after day, for the life of the lease.
Right-sizing your footprint to match real occupancy data, rather than theoretical full-attendance headcount, is one of the more effective ways to cut a tenancy’s operational carbon footprint without any change to staff numbers.
Sustainable space planning also favours flexible, multi-purpose layouts over single-use rooms, since a room that serves several functions delivers more value per square metre of embodied and operational carbon than one that sits idle most of the week. Choosing durable, modular furniture that can be reconfigured as density targets shift avoids the waste of a full refit every time headcount or working patterns change.
The tighter link between occupancy data and space allocation that’s emerged since the pandemic works in sustainability’s favour too. Businesses that use desk-booking and occupancy analytics to set realistic density targets aren’t just saving on lease costs. They’re avoiding the embodied carbon of unnecessary fit-out and the ongoing energy waste of running services for space nobody’s using.
What different space allocations cost your business
Space allocation decisions carry costs well beyond the base rent line, and getting the ratio wrong compounds those costs for the entire lease term.
The most obvious cost is straightforward: more square metres per person means a bigger footprint, which multiplies directly against your rate per square metre. But that’s only the starting point. Higher density (say 8 to 10 square metres per person) usually means lower base rent but higher spend on desk-booking technology, acoustic treatment and additional breakout space to offset the wellbeing risks of tighter packing. Lower density (14 to 20 square metres) drives up base rent and often outgoings, but can reduce churn-related fit-out costs since there’s more room to absorb headcount growth without triggering an early relocation.
Getting the presence rate wrong is where the real financial risk sits. Over a five or ten year lease term, that gap compounds into a substantial ongoing cost that never shows up as a single line item, just a slow drag on the bottom line.
Fit-out costs scale with density too. Higher density layouts generally cost less per square metre to fit out overall, since there’s less area to service, but more per desk once you factor in the technology and design work needed to make tight benching feel workable rather than cramped.
Sources
- Compliance code: Workplace facilities and the working environment — WorkSafe Victoria
- Good work design — Safe Work Australia
- How much office space do I need per employee? — Servcorp blog
- Realcommercial